I’ve posted here before about about why to forecast basic business numbers and how to forecast better. I write about the value of realistic forecasting in those posts and others. So for this post I want to address what makes a forecast realistic. How can we tell? What do we look for?
As I do, I’ll look at two important variations. First, business forecasts for an existing ongoing company. Second, business forecasts for a new company, not started yet, in the planning stages. Both cases are different. In this post we look at realistic forecasts for ongoing. Next month we’ll look at realism for startups.
Align your types and categories and units
Start with the obvious: coordinate your forecast with your past results. Make sure that the types, categories, and items you put into your forecast match the types, categories, and items you get reports on from your bookkeeping. Specifically, if you think of a forecast in a spreadsheet view with labels in the leftmost column and months across the top in the top row. Way too often people set up forecasts using different categories than what they get in accounting reports. Keep past and future aligned.

As you develop forecasts, think about metrics. For example, you could forecast sales as broken into units, average price, and sales; or just as sales, in dollars. What you want is metrics you can act on, to make decisions. Tracking by units and price helps you manage your business by understanding whether your results varied in unit sales or average price.
Align your projections with the recent past
How well do projections match the recent past? Real life is full of gradual changes. Real life is full of things for which the recent past is the best predictor of the near future. Weather, for example. Kids grades in school. Business success. And your business’s sales, costs, and expenses.
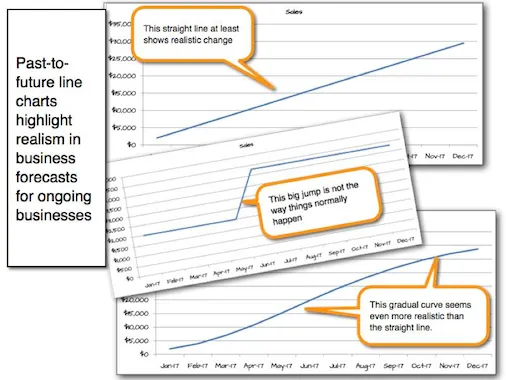
So, concretely, project reasonable logical change as you move forward into the future. For a quick test, draw or think of a line chart that takes any specific business number – sales, sales of a specific product, expenses, some specific category of expenses – and projects it as a line in a line chart that has money on the vertical axis and time on the horizontal. Have it draw a continuous line including results of the last year, and forecast for the next year. Suspect abrupt changes as lack of realism.
Understand what drives changes
Please don’t think I’m suggesting that forecasts always extrapolate the past into the future. No, of course; it’s not that simple. Changes happen. Your business launches new products or services, or new marketing or sales promotions. You expand to new markets. You want your business to grow and separate itself from the past, with sharp changes in curves. I’m a business owner too, I understand. We all want that.
What I am saying is that realistic forecasts understand and incorporate the drivers of change. You don’t just project better results next year for doing the same thing you’ve always done. Your improvements are linked conceptually to causes. You take the past, project it into the future, and then adjust it for changes you can predict.
The more you understand the causes of change, the more realistic the forecast.
Review and revise often
Remember, forecasts aren’t supposed to hold up to time. Forecasts are meant to be reviewed often, and revised. The point isn’t accurately guessing the future; it’s getting information you can use to manage.
About the author
